Quality & Evaluation of Software Architecture
Quality modeling, architecture evaluation, metrics & ATAM.
Introduction to Software Quality and Quality Modeling
Software Architecture and Quality are correlated. High-quality architecture leads to reliable, scalable, and maintainable systems — while neglecting quality results in costly failures and unsatisfied users.
Benefits of High Quality
- High Customer Satisfaction — higher user retention, more customers
- Reduced Maintenance Costs — system is more scalable, reliable, performant
- Competitive Advantage — easier to stand out in competitive market
Drawbacks of Poor Quality
- Low Customer Satisfaction — frequent crashes, slow performance → customers switch
- Increased Maintenance Costs — poor performance, low scalability, production issues → lower profit margins
When technical debt accumulates and architectural refactoring is neglected, systems undergo architecture erosion — a structural degradation that progressively worsens software quality.
requirements
System
observation unit
Attributes
observed properties
A quality model is a framework that helps define and categorize the attributes important for assessing software quality. It describes quality using criteria and specifies metrics to measure them.
"… degree to which a software product satisfies stated and implied needs when used under specified conditions." [ISO 25010:2011]
Aggregates attributes of a software product as a hierarchy of "quality characteristics" and "sub-characteristics" that relate to their suitability to fulfill defined or required needs.
Developers & architects
IT operations, user
User in specific context
Functional correctness
Functional appropriateness
Resource utilization
Capacity
User error protection
Accessibility
Fault tolerance
Recoverability
Non-repudiation
Accountability · Authenticity
Analyzability · Modifiability
Testability
Installability · Replaceability
Interoperability
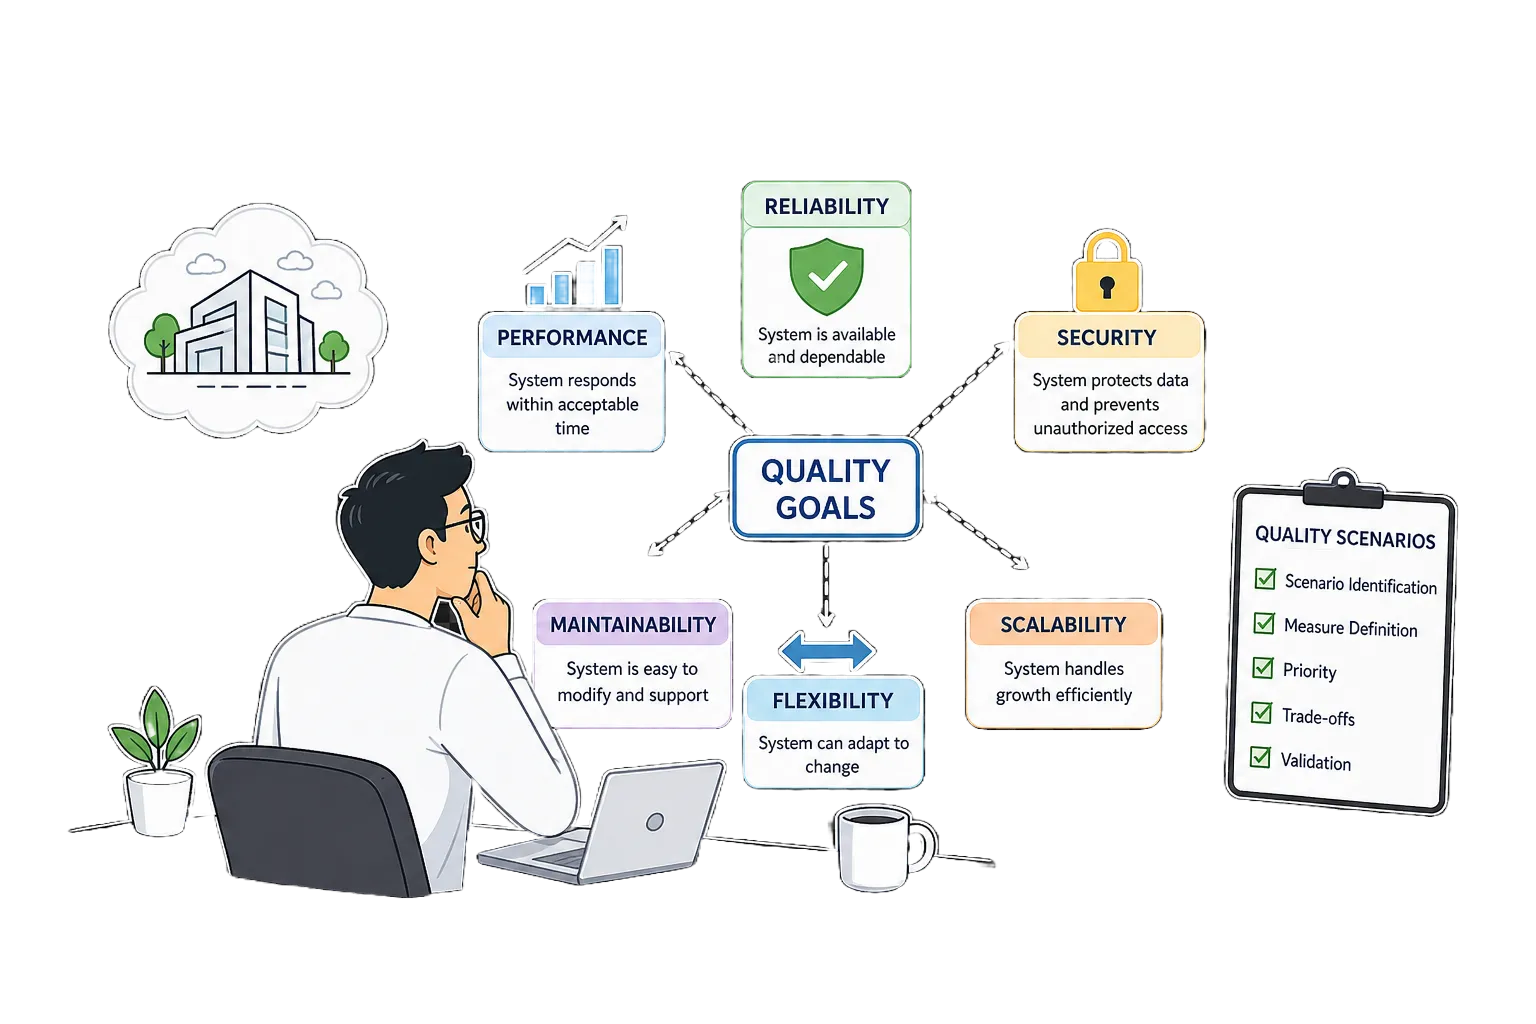
Quality goals structured as a tree. Quality scenarios form the leaves with priorities. A quality tree is specific to a particular system (quality model: generic).
(Time behaviour)
(Resource utilization)
(Modifiability)
- Provide more detail for specific quality requirements
- Describe how a system should behave when a specific stimulus occurs
- Allow to easily measure and determine whether quality requirements are fulfilled
- Typical interactions between users and system
- Describes: efficiency, performance etc.
- Software's ability to adapt to modification
- Adding additional functionality
- How the system scales with demand changes
- How well the system responds to extreme situations
- Power outages, sudden traffic spikes etc.
- Availability, fault tolerance under stress
Quality requirements need to be Exact and Measurable — otherwise, we cannot evaluate what we cannot measure.
- Motivation for defining and evaluating the quality of a software system
- Quality definition: "The correspondence between the observed properties and the previously defined requirements of an observation unit"
- Quality models (Model of McCall, Model of Boehm, FURPS, ISO/IEC 25010)
- Break quality goals into quality scenarios and build quality trees.
- Three types of quality scenarios:
- Usage Scenario (also called Application scenario)
- Growth Scenario (also called Change / Modification scenario)
- Exploratory Scenario (also called Boundary or Stress / Failure scenario)
Introduction to Evaluation of Software Architecture
- Identify risks in the architecture
- Verify achievement of quality goals
- Verify all stakeholder concerns are met
- Verify conformance to design decisions
- Identify critical parts within the system
- Measure and compare with known metrics
"You cannot control what you cannot measure."
— Tom DeMarcoCloud diagrams · Data models
Interfaces, cross-cutting concerns
Quality scenarios · User surveys
Interviews and feedback
Complexity · Dependencies
Size of components
May uncover: incorrect requirements, low cohesion components
Penetration tests · etc.
Crashes + Users/System errors
- Metrics — LOC, coupling, complexity…
- Reviews of Code & Design
- Audits of Code & Design
- Structural: change/bugfix effort per subsystem, errors per component
- Metrics — time & resource usage
- Tests: Performance Tests, Security Tests (Fuzzing), Usability Tests
Static ↔ Dynamic interdependency: Metrics from static analysis may affect dynamic analysis — e.g. high cyclomatic complexity can indicate potential runtime performance issues. Conversely, metrics from dynamic analysis may influence static analysis — e.g. test coverage metrics may drive changes in code structure, affecting metrics like LOC, coupling, etc.
Software → some number
- Measure & compare with known quantities (LOC, dependencies, complexity, test coverage…)
- Problem cases: Concepts, structures, decisions, documents
- Identification of risks
- Shows (non-)achievement of quality requirements
- Motivation + importance of evaluating software architecture to:
- Identify risks
- Prevent growing complexity
- Ensure achievement of quality goals
- Conformance of implementation to the design decisions
- Sources of information:
- Architecture Documentation
- Requirements Documentation
- Source Code
- Revision history
- Test Cases and Results
- Runtime events
- Types of assessment for software architecture:
- Static vs dynamic
- Quantitative vs qualitative
Quantitative Evaluation of Software Architecture & Goodhart's Law
- Metrics — Measurable indicators used to assess the characteristics and quality of the software architecture
- Can be used to measure the system both:
- Statically; and
- Dynamically
- Can be used to measure the system both:
- Requirements
- Rate of change
- Example: A high rate of change may indicate:
- We didn't do a good job of identifying and analyzing the requirements.
- The system is not flexible enough
- Source Code
- Size in lines of code (LoC)
- Complexity (e.g., cyclomatic complexity)
- Dependencies between building blocks
- Afferent vs Efferent coupling
- Cohesion
- Note: Needs manual assessment
- Failure
- Mean Time Between Failures (MTBF)
- Mean Time To Recovery (MTTR)
- Uptime/downtime
- Error Rate
⚠ Note: Watch out for error clusters! Components where many errors have been found probably contain even more.
- Performance
- Latency
- Throughput
- Utilization
- Saturation
- Software Process
- Number of implemented / tested features over time
- Meeting time in relation to working time
- Number of managers, developers, testers
- Test
- Number of tests
- In total
- Per class or package
- Per requirement
- Test coverage (percentage)
- Number of tests
Cyclomatic complexity measures the number of independent paths through a program's code. More decision points (if, else, switch, loops) = more paths = higher complexity = harder to test and maintain.
✅ Low Complexity (M = 1)
No branches — single straight path
4 edges, 5 nodes → M = 4 − 5 + 2 = 1
⚠️ High Complexity (M = 4)
Multiple branches — many paths
8 edges, 6 nodes → M = 8 − 6 + 2 = 4
Rule of thumb: M = 1–5 is simple and easy to test. M = 6–10 needs attention. M > 10 is risky — consider refactoring into smaller functions.
Stable
Unstable
- As a metric: Good indicator to detect bug risks
- As a goal (e.g. 100%): Becomes meaningless — developers write trivial tests just to hit the target
- As a metric: Can help find overly complex parts
- As a goal: Developers will abuse it — writing verbose or padded code
- Metrics are:
- Measurable indicators used to quantitatively assess the characteristics and quality of the software architecture.
- Examples of metrics:
- Requirements — Rate of change
- Source Code — LoC, cyclomatic complexity, Coupling (Afferent, Efferent)
- Failure — MTBF, MTTR, Uptime/downtime, Error rate
- Performance — Latency, Throughput, Utilization, Saturation
- Software Process — Number of implemented/tested features over time, time in meetings, number of managers etc.
- Tests — Number of tests, test coverage etc.
- Goodhart's Law — "When a measure becomes a target, it ceases to be a good measure."
Qualitative Assessment of Software Architecture & ATAM
- Quantitative evaluation (software → some number)
- Measure, compare with known quantities (e.g. LOC, dependencies, complexity, test coverage, …)
- Problem cases: Concepts, structures, decisions, documents
- Qualitative analysis and assessment
- Identification of risks
- Shows (non-)achievement of quality requirements
Assessments based on scenarios — they describe possible usages of the system by an actor, help view architecture decisions from different perspectives, and help identify quality criteria even when requirements are incomplete.
- Selection of a suitable software architecture for a system
- Scenario-based assessment regarding quality goal fulfilment
Business Drivers → Quality Attributes → Scenarios with priority notation: (Importance, Implementation difficulty)
Scenario-based matrix comparing requirements across different architectural scenarios (best, hybrid, progressive web app).
Decision Centric Architecture Review — focuses on architectural decisions through a structured 9-step process from preparation to retrospective.
Cost Benefit Analysis Method — evaluates architectural decisions based on cost-benefit tradeoffs for quality attribute achievement.
- Two approaches to assess the quality of software architecture:
- Quantitative Assessment approach
- Uses metrics to measure the characteristics of our system → evaluate the quality of our software architecture
- Qualitative Assessment approach
- Uses scenarios to compare the requirements and constraints to the proposed software architecture.
- Example: ATAM (Architecture Tradeoff Analysis Method)
- Quantitative Assessment approach
Defining Software Quality
- Quality = meeting explicit & implicit requirements
- ISO 25010 quality model — 8 characteristics
- Quality scenarios: stimulus → response → metric
Why & How to Evaluate
- Validate architecture against quality goals early
- Quantitative (metrics, benchmarks) vs. qualitative (review, scenarios)
- Evaluate continuously — not just once at the end
Metrics & Their Pitfalls
- Measure: response time, throughput, code coverage, complexity
- Goodhart's Law — when a measure becomes a target, it ceases to be a good measure
- Use metrics as indicators, not absolute truths
Qualitative Assessment
- Architecture Tradeoff Analysis Method
- Scenario-based: compare requirements to architecture decisions
- Identify sensitivity points, trade-offs & risks